
earch marketing has never been more complex—or more critical to business growth.
As the digital landscape continues to shift, how we visualize search marketing data must evolve.
The old ways of reporting are no longer enough. Static dashboards and siloed spreadsheets create blind spots, hiding key insights marketers need to drive meaningful outcomes.
In 2025, smarter search marketing data visualization is not a luxury—it is a necessity.
This article will explore why visualization strategies are changing, which new methods are rising to prominence, and how you can build a more resilient and actionable data visualization framework for your search marketing programs.
Why Search Marketing Data Visualization Must Evolve
For years, most search marketing reports followed a predictable formula.
Marketers tracked metrics like clicks, impressions, cost per click (CPC), and conversions in simple dashboards.
However, search ecosystems are more fragmented in 2025. Paid and organic are increasingly interconnected.
New AI-driven experiences in platforms like Google Search Generative Experience (SGE) and Bing are shifting user behaviors. Attribution windows are shrinking, privacy regulations are tightening, and audience targeting is becoming more probabilistic.
These changes make traditional, surface-level reporting insufficient.
Marketers need to visualize the entire search journey—from early impressions to revenue outcomes—with clarity across multiple channels and customer touchpoints.
Without smarter visualization approaches, it is easy to misinterpret performance signals, misallocate budget, or miss emerging opportunities entirely.
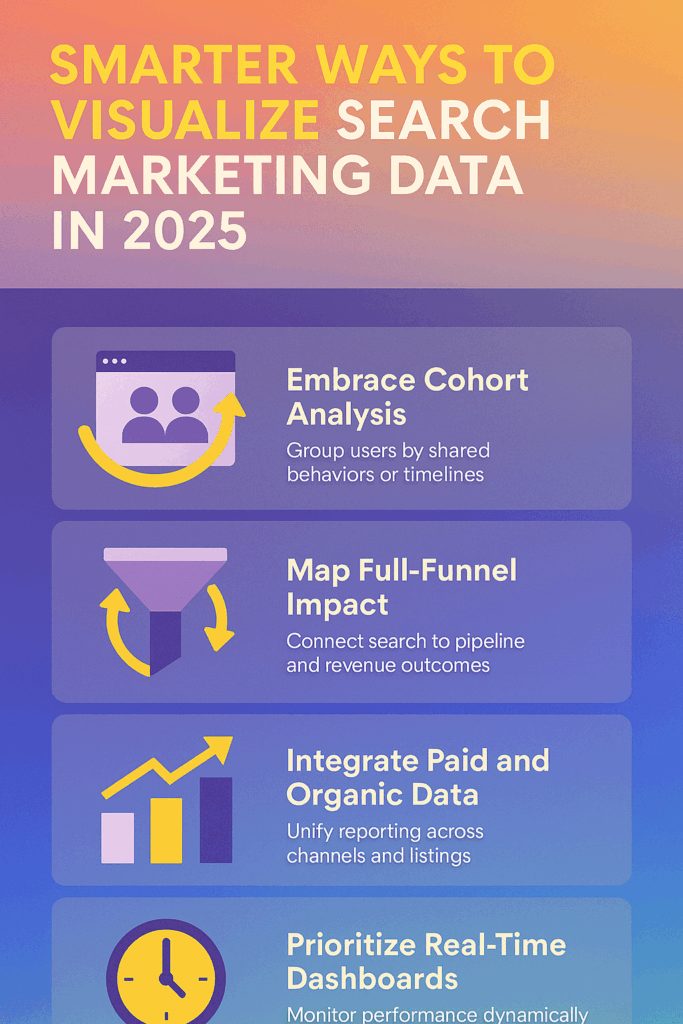
Embracing Cohort-Based Search Data Analysis
One of the biggest advances to visualize search marketing data in 2025 is the rise of cohort-based analysis.
Instead of looking at performance metrics in isolation, marketers now group users based on shared behaviors or timelines.
Examples of useful search cohorts include:
- Users who clicked paid search ads but converted through organic
- Visitors who first engaged via Google SGE before clicking through
- Users exposed to brand paid search and later converted on brand organic
Visualizing these cohorts helps marketers uncover true cause-and-effect patterns.
It reveals how search channels work together over time rather than viewing them as siloed entities.
More brands are building dynamic cohort visualizations to better understand:
- Lag time between initial search interaction and final conversion
- Channel crossover patterns
- The impact of assist interactions from paid search or organic listings
Cohort-based visualization reduces attribution error and paints a more realistic picture of search marketing effectiveness.
Mapping Full-Funnel Search Marketing Impact
Traditional search reports tend to focus on direct response outcomes like form fills, demo requests, or ecommerce sales.
But the most sophisticated search marketers in 2025 are visualizing full-funnel impact.
They are connecting search data to brand lift, engagement metrics, pipeline contribution, and long-term customer value.
Effective full-funnel search visualization now includes:
- Top-of-funnel: Growth in branded search volume, impression share in non-branded terms, new user sessions
- Mid-funnel: Increases in return visits, time on site, content downloads
- Bottom-of-funnel: Opportunities created, pipeline influenced, closed-won revenue
Mapping these stages allows marketers to show search’s contribution across the entire buying journey, not just at the conversion point.
It also creates more powerful storytelling to executives and boards—highlighting search marketing’s strategic value beyond basic lead generation.
Integrating Paid and Organic Search Data Seamlessly
In 2025, separating paid search and organic search reporting creates a dangerously incomplete view.
Users do not differentiate between an ad and an organic listing the way marketers do. Their journey is fluid.
The smartest search marketing data visualization strategies now blend paid and organic search seamlessly.
Unified reporting frameworks reveal:
- How often users interact with both paid and organic results before converting
- Which terms and topics perform better in paid, organic, or blended experiences
- How shifts in organic ranking affect paid search performance and vice versa
Tools like Looker Studio (formerly Google Data Studio), Tableau, and custom BI dashboards increasingly aggregate cross-channel data into integrated visualizations.
This holistic view helps marketers optimize search strategy in context, rather than optimizing paid or organic in a vacuum.
Moving Beyond Vanity Metrics to Meaningful KPIs
Clicks, CTR, and impressions still matter—but they are no longer enough.
Modern search data visualization must prioritize metrics tied to business impact, such as:
- Incremental pipeline generated
- Marketing sourced revenue
- Customer acquisition cost (CAC) relative to lifetime value (LTV)
- Share of branded search compared to competitors
- Return on ad spend (ROAS) with proper incrementality adjustment
Charts and dashboards that only show volume metrics without connecting them to real outcomes create a false sense of success.
Marketers must now align visualization frameworks directly to revenue-centric KPIs to drive smarter decision-making.
Prioritizing Real-Time and Dynamic Visualization
Search marketing conditions change rapidly. Competitors adjust bids, organic rankings fluctuate, and algorithms update.
Relying solely on monthly or quarterly reports risks missing critical shifts.
Real-time or near-real-time search marketing dashboards are becoming the new standard.
Dynamic visualizations allow teams to:
- Spot spend inefficiencies early
- Detect emerging keyword trends
- Adjust creative and bidding strategies faster
- Respond to competitor moves promptly
Platforms that auto-refresh data and trigger proactive alerts based on thresholds help marketers stay ahead of change rather than reacting too late.
Building flexible dashboards that pull from APIs like Google Ads, Search Console, and Bing Webmaster Tools gives marketers the agility required in 2025.
Building Better Search Marketing Data Culture
Ultimately, smarter search marketing data visualization is not just about technology—it is about culture.
The best marketing teams:
- Democratize access to search data across the organization
- Train teams to read and interpret visualizations correctly
- Foster a test-and-learn mindset rooted in data exploration
- Regularly audit visualizations for accuracy and relevance
Visualization is only powerful if the right people can act on the insights it reveals.
Investing in data literacy, governance, and storytelling skills will separate good search marketing organizations from great ones in the years ahead.
Conclusion: Visualization is the New Search Marketing Advantage
In 2025, the smartest search marketers will not just run better campaigns—they will see the full picture more clearly.
By embracing smarter ways to visualize search marketing data, you can:
- Detect opportunities earlier
- Optimize channel performance more precisely
- Tell more compelling ROI stories to leadership
- Build a future-proof search marketing engine
Data has always been the foundation of search success. But how you visualize, interpret, and act on that data is now what truly determines competitive advantage.

Hi there! I’m Scott, and I am the principal consultant and thought leader behind Stratus Analytics. I have a Master of Science degree in marketing analytics, and I’ve have been providing freelance digital marketing services for over 20 years. Additionally, I have written several books on marketing which you can find here on Amazon or this website.
DISCLAIMER: Due to my work in the packaging industry, I cannot take on freelance clients within the packaging manufacturing space. I do not want to provide disservice to your vision or my employer. Thank you for understanding.